
Clinical Trial Safety Metric Calculator
Input Data
How It Works
IR
Incidence Rate
= Events / Total Patients
Simple percentage that ignores treatment duration
EIR
Event Incidence Rate
= Events / Patient-Years
Accounts for time exposure
EAIR
Exposure-Adjusted Incidence Rate
= Adjusts for recurrence and treatment breaks
FDA-recommended for accurate safety assessment
Results
When a new drug is tested in a clinical trial, the goal isn’t just to see if it works - it’s to understand how safe it really is. One of the most important ways we measure safety is by tracking adverse events: unwanted side effects, reactions, or complications that happen during treatment. But how do you decide if one drug is safer than another? A simple percentage - like "15% of patients had nausea" - might sound clear. But it can be wildly misleading. That’s where understanding percentages and relative risk becomes critical - especially when the FDA is asking for more accurate methods.
Why Simple Percentages Fail
The most common way to report adverse events is the Incidence Rate (IR). It’s simple: divide the number of people who had an event by the total number of people treated. If 30 out of 200 patients got a rash, that’s a 15% rate. Easy. But here’s the problem: what if one group took the drug for 3 months and another took it for 2 years? The IR doesn’t care. It treats both groups the same, even though the longer-exposed group had far more opportunity for side effects to appear. This isn’t just a technical glitch - it’s a safety blind spot. A 2010 analysis found that using IR alone could underestimate true event rates by 18% to 37% in trials where treatment durations varied. Imagine a cancer drug that causes fatigue. If patients on Drug A stay on treatment for 18 months and those on Drug B stop after 3 months, the IR might show Drug B as safer. But that’s not because Drug B is safer - it’s because patients just didn’t have enough time to develop the side effect. That’s not safety. That’s timing.Enter Patient-Years: The EIR Method
To fix this, researchers started using Event Incidence Rate adjusted by Patient-Years (EIR). Instead of counting people, you count time. One patient taking a drug for 1 year = 1 patient-year. Ten patients taking it for 6 months each = 5 patient-years. You then calculate how many events happened per 100 patient-years. For example: if 25 patients had headaches over 500 total patient-years of exposure, the EIR is 5 events per 100 patient-years. This gives you a rate that reflects how often side effects occur over time, not just how many people experienced them. It’s especially useful for chronic conditions where patients stay on treatment for years - like rheumatoid arthritis or hypertension. But EIR has its own flaw. If one patient has five separate headaches during treatment, EIR counts each one. That inflates the risk. You’re not measuring how many people are affected - you’re measuring how many times something happened. That’s fine for rare, serious events like liver failure. But for common, mild events like dizziness, it can make a drug look riskier than it really is.The FDA’s Push for EAIR
In 2023, the FDA made a clear move: they requested Exposure-Adjusted Incidence Rate (EAIR) in a supplemental biologics license application. This wasn’t a suggestion. It was a signal. EAIR is more complex. It doesn’t just account for time - it also accounts for recurrence and treatment interruptions. If a patient stops the drug for two weeks due to a side effect, then restarts, EAIR adjusts for that gap. If a patient has three episodes of vomiting over 12 months, EAIR captures that pattern, not just the count. The result? A more accurate picture of real-world safety. MSD’s safety team found that switching to EAIR revealed previously hidden safety signals in 12% of their drug programs - especially for long-term therapies. Roche, on the other hand, found that 35% of medical reviewers initially misread EAIR results because they weren’t trained on it. That’s the catch: better methods need better training.Relative Risk and the Real Safety Story
Now, let’s say Drug A has an EAIR of 8 events per 100 patient-years, and Drug B has 4. The relative risk - or Incidence Rate Ratio (IRR) - is 2.0. That means patients on Drug A are twice as likely to experience the event per unit of time. But here’s what most people miss: relative risk doesn’t tell you the absolute risk. If Drug A causes 8 events per 100 patient-years, that’s still only 0.08 events per person per year. Even with a relative risk of 2, the actual increase is small. That’s why you need both numbers: the EAIR to understand the baseline, and the IRR to compare treatments. The FDA and EMA now expect both. The ICH E9(R1) guidelines, updated in 2020, require safety analyses to consider exposure time and treatment discontinuation. That means if you’re submitting data to regulators, you can’t just give percentages anymore. You need to show how risk changes over time - and how it compares between arms.Implementation Challenges
Switching from IR to EAIR isn’t just a math problem - it’s a systems problem. Pharmaceutical statisticians report that EAIR takes 3.2 times longer to program than IR. A typical EAIR analysis might take 14.7 hours versus 4.5 hours for IR. Common mistakes? Incorrect date handling (28% of cases), ignoring treatment breaks (19%), and inconsistent patient-year calculations (23%). CDISC, the global standard for clinical data, now requires EAIR reporting for serious adverse events in oncology trials (v3.0, 2023). SAS and R have standardized macros for EAIR - the PhUSE GitHub repository for these tools has been downloaded over 1,800 times since 2023. Still, 42% of companies report formatting issues when submitting EAIR to regulators who aren’t familiar with the metric.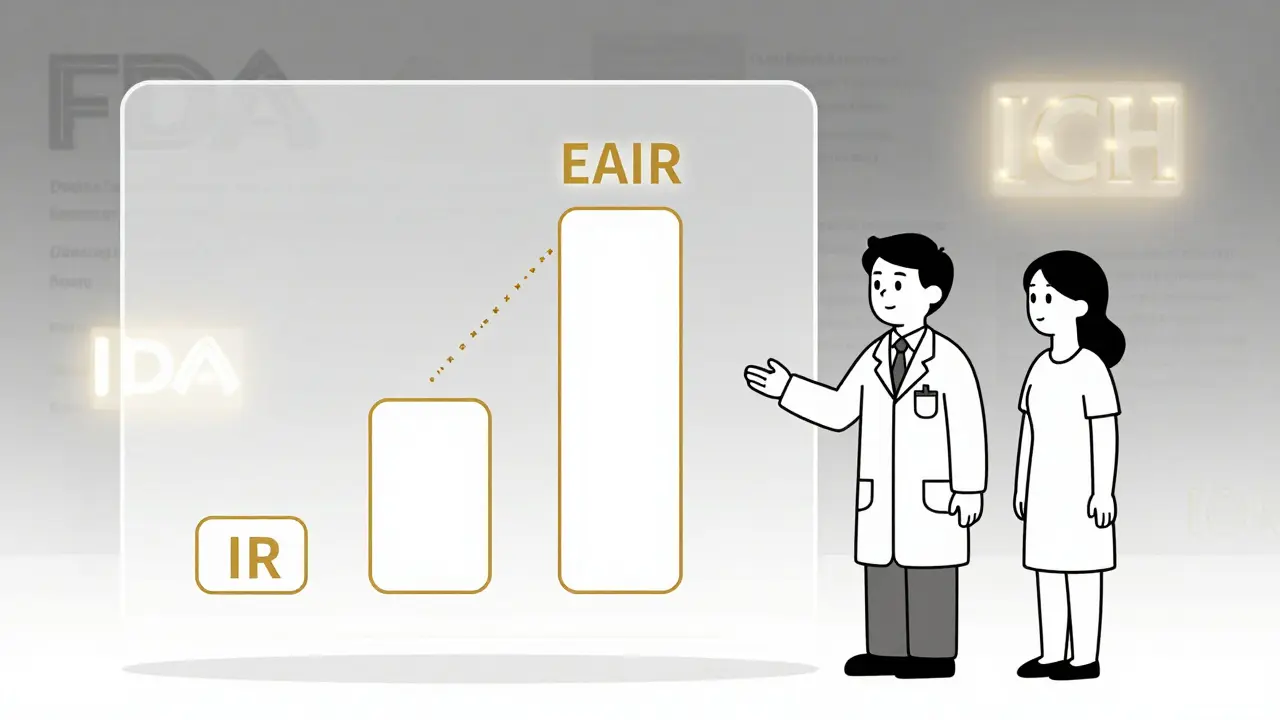
What’s Next?
The industry is moving fast. In 2020, only 12% of FDA submissions included exposure-adjusted metrics. By 2023, that jumped to 47%. The global clinical trial safety software market hit $1.84 billion in 2023, growing at 22.7% yearly - all because regulators are demanding better data. The FDA’s 2024 draft guidance on exposure-adjusted analysis proposes standardized EAIR formulas. The European Network of Pharmaceutical Medicine is testing EAIR across 15 disease areas - early results show it outperforms IR in 11 of them. And the FDA’s Sentinel Initiative is now using machine learning to detect safety signals from EAIR data - with 38% better accuracy than old methods. By 2027, experts predict 92% of Phase 3 drug submissions will include EAIR alongside traditional IR. The days of reporting simple percentages as safety metrics are ending. The new standard is time, recurrence, and context.What You Need to Know
If you’re reading clinical trial data - whether you’re a doctor, a patient, or a researcher - here’s what matters:- Never trust a percentage without knowing the exposure time.
- Look for EIR or EAIR - not just IR - in safety tables.
- Check if the study reports relative risk (IRR) alongside absolute rates.
- If treatment durations vary between groups, ask: "Was exposure time accounted for?"
- Be wary of claims that one drug is "much safer" - small absolute differences can look big in relative terms.
What’s the difference between IR and EAIR in adverse event reporting?
Incidence Rate (IR) is a simple percentage: number of people who had an event divided by total people treated. It ignores how long each person was exposed. Exposure-Adjusted Incidence Rate (EAIR) accounts for both the duration of exposure and how often events recur. EAIR calculates events per unit of time (like per 100 patient-years), making it more accurate when treatment lengths vary between groups.
Why does the FDA prefer EAIR now?
The FDA started requesting EAIR in 2023 because IR often misrepresents safety. For example, if one group takes a drug for 2 years and another for 3 months, IR makes the shorter group look safer - even if the drug causes the same side effect over time. EAIR reveals true risk patterns by adjusting for exposure duration and event recurrence, giving regulators a clearer picture of long-term safety.
Is a higher relative risk always dangerous?
No. Relative risk compares two groups, but it doesn’t show the actual chance of harm. For example, if Drug A has an EAIR of 10 events per 100 patient-years and Drug B has 5, the relative risk is 2.0 - meaning Drug A doubles the rate. But if that’s only 10 events per 100 people over a year, the absolute risk is still low. Always look at both the relative risk and the absolute rate to judge real-world impact.
What’s patient-year calculation and why does it matter?
A patient-year is the total time a person spends in a study while exposed to the treatment. If 10 patients each take the drug for 6 months, that’s 5 patient-years (10 × 0.5). This matters because it lets you calculate how often events happen over time, not just how many people experienced them. It’s the key to fair comparisons between groups with different treatment durations.
Can I trust adverse event rates from drug labels?
Some labels still use simple percentages (IR), which can be misleading. Check if the label specifies whether the rate is adjusted for exposure time. If not, or if the trial had varying treatment lengths, the number may not reflect true risk. For accurate safety info, look for EAIR or EIR in clinical trial publications or FDA review documents.
What should I do if I see conflicting safety data between studies?
Compare the methods used. If one study uses IR and another uses EAIR, they’re measuring different things. Look for exposure duration, how events were counted (per person or per event), and whether treatment interruptions were accounted for. If the studies aren’t using the same metrics, the data isn’t directly comparable - and you need more context before drawing conclusions.


14 Comments
Man, this whole EAIR thing is such a game-changer. I used to just glance at percentages and think, 'Oh, 15% side effects, that's bad.' But now I get it - time matters. If someone's on a drug for 2 years, they're gonna have more chances for stuff to pop up. It's not about how many people got sick, it's about how often sickness happens while they're actually exposed. That's real safety data. The FDA's finally catching up to how medicine actually works in the real world, not in some lab fantasy where everyone takes the pill for exactly 90 days.
And honestly, I wish more patients knew this. We get handed drug labels like they're scripture, but half the time they're using IR, which is like measuring how many people got wet in a rainstorm without saying how long they stood outside. EAIR is the difference between 'I got rained on once' and 'I stood in the storm for 12 hours and got soaked 7 times.' One's a headline. The other's a weather report.
Also, the fact that 35% of reviewers at Roche got confused by EAIR? That's not a flaw in the method - that's a flaw in training. We need to teach this in med school, not just in biostatistics grad seminars. This isn't niche math. This is how we decide if a drug is actually safer or just better at hiding its side effects.
And don't even get me started on relative risk. A 2x increase sounds scary until you realize it's going from 0.05 to 0.10 events per year. That's less than a 1 in 1000 chance per month. We panic over percentages like they're lottery odds, but the actual risk is often tiny. Context is everything. Thanks for laying this out so clearly.
Also, I'm now Googling 'patient-year calculator' because I want to apply this to my own meds. Just saying.
They're making this harder just to make pharma look better. EAIR? Patient-years? This is just corporate math to bury the truth. You think they care about safety? They care about approval. They want you to think 8 events per 100 patient-years is 'manageable' when it's still 8 people getting liver failure or stroke or god knows what. They don't want you to see the real numbers - they want you to see a sanitized, time-adjusted version that makes their drug look like a miracle.
And don't even get me started on the 'relative risk' excuse. 'Oh it's only a 0.08% increase per year!' Yeah, right. Multiply that by 10 million patients. That's 8,000 people getting hurt. And they call that 'acceptable'? That's not science - that's capitalism dressed in a lab coat.
They're not improving safety. They're improving PR.
And now they want us to learn new metrics? No thanks. I'll stick with the old percentages - at least they're honest about how many people got screwed.
ok so i just read this whole thing and i think i get it but like… patient years? isnt that just total days divided by 365? why do we need a fancy name for that? also i think they misspelled incidence in one place? or was that on purpose? anyway i think eaar is just ir but with more math and more time spent in excel. and why do we need to know if someone had 3 headaches? i just want to know if i might puke or die. also i think the fda is just trying to make pharma spend more money. not that i blame them. theyre rich. but still.
also why does this matter to me? im not a statistician. im just trying to not die on this new pill.
so like… is it safer? yes or no? why is this so complicated?
Ugh. Another overcomplicated, jargon-filled post from someone who thinks math makes them smarter than patients. You're not helping. You're confusing people. 'EAIR'? 'EIR'? 'IRR'? Who even cares? I just want to know: will this drug kill me? Will it make me tired? Will I throw up every day?
And you think a percentage is misleading? Try reading a drug label where they say 'nausea occurred in 15% of patients' - then in the footnote, buried in 10-point font, it says 'excluding patients who discontinued due to nausea.' So they removed the people who got sick enough to quit - and then called the rest 'safe.'
That's not science. That's fraud. And now you want us to learn patient-years? No. Just give us the truth. Simple. Clear. No math tricks. No fancy metrics. Just tell me what actually happens. That's all I need.
Stop hiding behind statistics. Start being honest.
Okay, I'm not a scientist but I'm a patient with RA and I've been on three different drugs over 8 years - and I can tell you, this whole EAIR thing? It's a lifeline.
My first drug? I got dizzy every day for 6 months. They said 'only 12% of patients reported dizziness.' But I was one of them - and I was on it for 18 months. So I had dizziness 18 months straight. That’s not 12%. That’s 100% of my time.
My second drug? They said 8% had headaches. But I had one every other week. So I had 26 headaches in a year. Was I part of the 8%? Yes. But the report didn’t say how many times I got them. That’s like saying '10% of people got into car accidents' - but not saying if they totaled their car once or 12 times.
EAIR finally makes sense. It’s not about how many people got sick - it’s about how often sickness shows up while you’re actually taking the drug. That’s real. That’s my life. And yes, it takes longer to calculate. But if it saves one person from thinking 'it’s just dizziness, it’ll pass' when it’s actually a sign of something worse? Worth it.
Also, thank you for writing this. I’m sharing it with my support group.
And yes, I cried reading it. Because for once, someone got it.
While the push toward EAIR is commendable from a methodological standpoint, one cannot overlook the institutional inertia that continues to undermine its adoption. The statistical community has been slow to integrate exposure-adjusted metrics into standard curricula, and regulatory bodies remain inconsistent in their enforcement of standardized reporting formats. Moreover, the proliferation of proprietary software tools - many of which lack interoperability - introduces additional layers of error, particularly in the handling of treatment interruption windows and non-linear exposure patterns.
Furthermore, the assumption that EAIR provides a 'more accurate' picture is predicated on the integrity of the underlying data. If patient diaries are self-reported and subject to recall bias - as they often are in real-world settings - then even the most sophisticated algorithm cannot salvage flawed inputs. The metric is only as reliable as the records it consumes.
And while the FDA's 2024 draft guidance is a step forward, the absence of mandatory standardized definitions for 'treatment interruption' and 'recurrence threshold' leaves significant room for interpretation. Until these are codified at the international level - preferably under ICH E9(R1) - we risk creating a patchwork of conflicting analyses that undermine the very goal of comparability.
Transparency is not achieved through complexity. It is achieved through uniformity, clarity, and accountability.
Why are we even doing this? America leads the world in drug innovation. We don’t need Europe telling us how to count side effects. EAIR? Patient-years? This is just more globalist nonsense. The FDA should focus on getting life-saving drugs out faster not spending 14 hours doing math no one understands. If a drug helps people live longer and feel better, stop overanalyzing the nausea. People in China and India don’t have time for this. We do. And we should be proud of that.
Also I think the FDA is just trying to look smart. They don’t know what they’re doing. They just want to look like they’re doing something. Let’s go back to percentages. Simple. Fast. American.
Wait. So you're telling me the whole drug safety system is based on a lie? That the percentages we've been trusting for decades are meaningless because they ignore time? And now they're changing the rules because they got caught?
And you're surprised people don't trust medicine anymore?
Let me guess - the same people who told us 'aspirin is safe' and then we found out it causes stomach bleeds… and then 'Vioxx is safe' and then 27,000 people died… and now they're saying 'trust us, this new math is better' - and we're supposed to believe them?
This isn't progress. This is damage control.
And don't even get me started on the fact that EAIR takes 3x longer to calculate. That means they've been lying for years and just didn't want to do the work. Now they're making us learn a new language so we don't notice the same old scam.
I'm not buying it.
Oh wow. Another post where someone pretends they're revealing some deep, hidden truth about pharmaceuticals - as if no one else has noticed that drug safety reporting is a carefully curated illusion. You think EAIR is the answer? Please. It's just the same manipulation, now with more decimals.
You say 'relative risk doesn't tell you absolute risk' - as if patients are too stupid to understand that. But you're the one who thinks we need a PhD to interpret a drug label. The real problem isn't the metric. It's the fact that we're being sold drugs like they're groceries, and then told to trust the fine print written by lawyers who also wrote the safety data.
And you wonder why people are skeptical? You don't fix trust by adding more math. You fix it by being honest. No one cares about patient-years. They care if their kid will vomit every day. If their mother will have a stroke. If they'll die before they get their pension.
So go ahead. Calculate your EAIR. I'll keep trusting my gut - and the people who actually lived through the side effects, not the spreadsheet that sanitized them.
so like i just read this and i think i get it but honestly why does it matter if its 8 events per 100 patient years or 15 percent if the drug makes you feel like crap anyway
also why do we need to count every single headache like its a crime scene
and who even has time to learn this stuff
the fda is just making pharma spend more money and confusing patients
also i think they meant eair not eaar
and why is this even a thing
just tell me if its safe or not
why is everything so complicated now
It's fascinating how the industry has weaponized complexity to obscure rather than clarify. EAIR is not a breakthrough - it's a rebranding of the same flawed paradigm. The assumption that time-adjusted metrics inherently improve safety interpretation is philosophically naive. Risk is not a function of exposure duration alone - it's a function of biological vulnerability, genetic predisposition, and comorbidities, none of which are captured by patient-years.
Furthermore, the emphasis on recurrence counts as a metric for mild events like dizziness or nausea is not just statistically inappropriate - it's ethically perverse. It pathologizes normal physiological responses to pharmacological agents. A headache is not an 'event' - it's a symptom. And reducing human experience to a countable variable is the very essence of dehumanization in modern medicine.
The FDA's push for EAIR is not about safety. It's about control. It's about creating a language only insiders can speak - a language that excludes patients, clinicians, and even many researchers. The real goal is not transparency. It's gatekeeping.
And yet, we celebrate this as progress.
man i just want to say thank you for writing this
i work in a clinic and we get patients all the time who are scared because they read '15% chance of side effects' on a label and think they're gonna die
but when we explain that 15% means 15 out of 100 people had it over 3 months - and that most of those were mild and went away - they breathe easier
so yeah i get why the fda wants eaar
it's not about making it harder
it's about making it fairer
and honestly i wish more people knew how to read these numbers
we're not trying to confuse you
we're trying to stop you from being scared of nothing
and yes it takes longer to calculate
but if it saves one person from quitting their meds because they thought they were doomed
then it's worth it
thanks again
Wait - so you're telling me the FDA is suddenly concerned about patient safety? Since when? They approved opioids that killed half a million people. They approved Vioxx. They approved the COVID vaccines without long-term data. Now they're suddenly worried about how many headaches someone had?
This is a distraction. A smokescreen. They're trying to make you think they're being careful - but they're still approving drugs with deadly side effects, just with fancier charts.
And you know what? They're using EAIR to delay approvals. That's why they're pushing it. Not for safety. For control. To slow down competition. To protect Big Pharma's profits by making new drugs take 3x longer to get approved.
They're not protecting you. They're protecting the system.
And you're falling for it.
Wake up.
This isn't science.
This is politics.
And you're the one paying for it.
Wow. I just read the comment from Sarah-Jane Vincent and… wow. I get why people are angry. I really do. But let me say this: if the FDA was just doing this to slow down competition, why did they start pushing EAIR for oncology drugs? Cancer patients don't have time to wait. They need answers now. And yet - EAIR is being mandated for them. Why? Because the side effects are brutal, and the treatment lasts years. They need to know: is this drug killing me faster than the cancer?
And yes, the FDA has failed before. But that doesn't mean every reform is a lie. It means we have to hold them accountable - not reject the tools that could save lives.
EAIR isn't perfect. But it's better than pretending time doesn't matter.
And if you think the system is broken - don't throw out the thermometer because the last doctor misread it. Fix the system. Use the tool. Demand better data. Don't let fear make you blind to progress.
Also - thank you, Sarah-Jane, for being so passionate. I need people like you to keep pushing. Just… maybe not assume every change is a conspiracy.